No evidence for systematic voter fraud: A guide to statistical claims about the 2020 election
Edited
by Kenneth A. Shepsle, Harvard University, Cambridge, MA, and approved
August 30, 2021 (received for review February 22, 2021)
Significance
President
Donald Trump claimed that the 2020 US presidential election was stolen;
millions of Americans apparently believed him. We assess the most
prominent statistical claims offered by Trump and his allies as evidence
of election fraud, including claims about Dominion voting machines
switching votes from Trump to Biden, suspiciously high turnout in
Democratic strongholds, and the supposedly inexplicable failure of Biden
to win “bellwether counties.” We use a combination of statistical
reasoning and original data analysis to assess these claims. We hope our
analysis contributes to public discussion about the integrity of the
2020 election and broader challenges of election security and election
administration.
Abstract
After
the 2020 US presidential election Donald Trump refused to concede,
alleging widespread and unparalleled voter fraud. Trump’s supporters
deployed several statistical arguments in an attempt to cast doubt on
the result. Reviewing the most prominent of these statistical claims, we
conclude that none of them is even remotely convincing. The common
logic behind these claims is that, if the election were fairly
conducted, some feature of the observed 2020 election result would be
unlikely or impossible. In each case, we find that the purportedly
anomalous fact is either not a fact or not anomalous.
Sign up for PNAS alerts.
Get alerts for new articles, or get an alert when an article is cited.
Following
the 2020 US elections, President Trump and other Republicans questioned
Biden’s victory in public statements and lawsuits. Although Trump’s
legal challenges were unsuccessful, many of his supporters were
apparently convinced by his claims that the election was stolen: A
survey in December 2020 found that over 75% of Republican voters found
merit in claims that millions of fraudulent ballots were cast, voting
machines were manipulated, and thousands of votes were recorded for dead
people (1).
In
this paper, we consider several widely disseminated claims purporting
to call into question the 2020 US presidential election result. We focus
on statistical claims, i.e., claims that are based on allegedly
anomalous patterns in the official vote counts. The common logic of
these claims is that some aspect of the 2020 result would be highly
unlikely or even impossible if the election had been properly
administered. We performed an extensive search to identify the most
pervasive such claims appearing in social media posts, expert witness
testimony, and research papers.*
Our purpose in this paper is to address several of the most pervasive
statistical claims in one place and using a common conceptual framework.
We
conclude that each of the statistical claims we consider fails in one
of two ways. In some instances, accurate claims are made about the
election results but they are not actually inconsistent with a free and
fair election. In other instances, the supposedly anomalous fact about
the 2020 election result turns out to be incorrect.
The
2020 election was remarkable in many ways (e.g., unusually high levels
of mail-in voting and turnout), and election administration may well
have been imperfect. But we see nothing in these statistical tests that
supports Trump’s claim of a stolen election.
This research builds on efforts to assess the prevalence of fraud in prior elections in the United States (2 –4) and other democracies (5).
We also work in parallel with a large number of legal briefs filed by
political science experts after the 2020 election (for example, refs. 6 and 7).
Claims Based on Facts That Are Not Actually Anomalous
Biden’s Share of US Counties Is Not Anomalous
Conservative
radio talk show host Charlie Kirk tweeted on 20 December 2020, “Does
anyone else have a hard time believing Joe Biden won a record-high
number of votes despite winning a record-low number of counties?Ӡ
Later that day, he provided numbers to back up the claim, stating that
Barack Obama won 69 million votes and 873 counties (in 2008) and Donald
Trump won 74 million votes and 2,497 counties (in 2020), while Biden won
81 million votes and just 477 counties (also in 2020).‡
While Kirk understated the number of counties Biden won (537, not 477),
the basic fact is correct: Biden won far more votes than Trump or Obama
while winning far fewer counties than Trump and somewhat fewer counties
than Obama.§ If Biden won so few counties, how could he have legitimately won so many votes?¶
Adding
minimal context to Kirk’s numbers reveals that there is nothing
remotely suspicious or even anomalous about them. The reason Biden won a
clear majority of votes while winning a minority of counties is that
his support was concentrated in populous counties. This is typical of
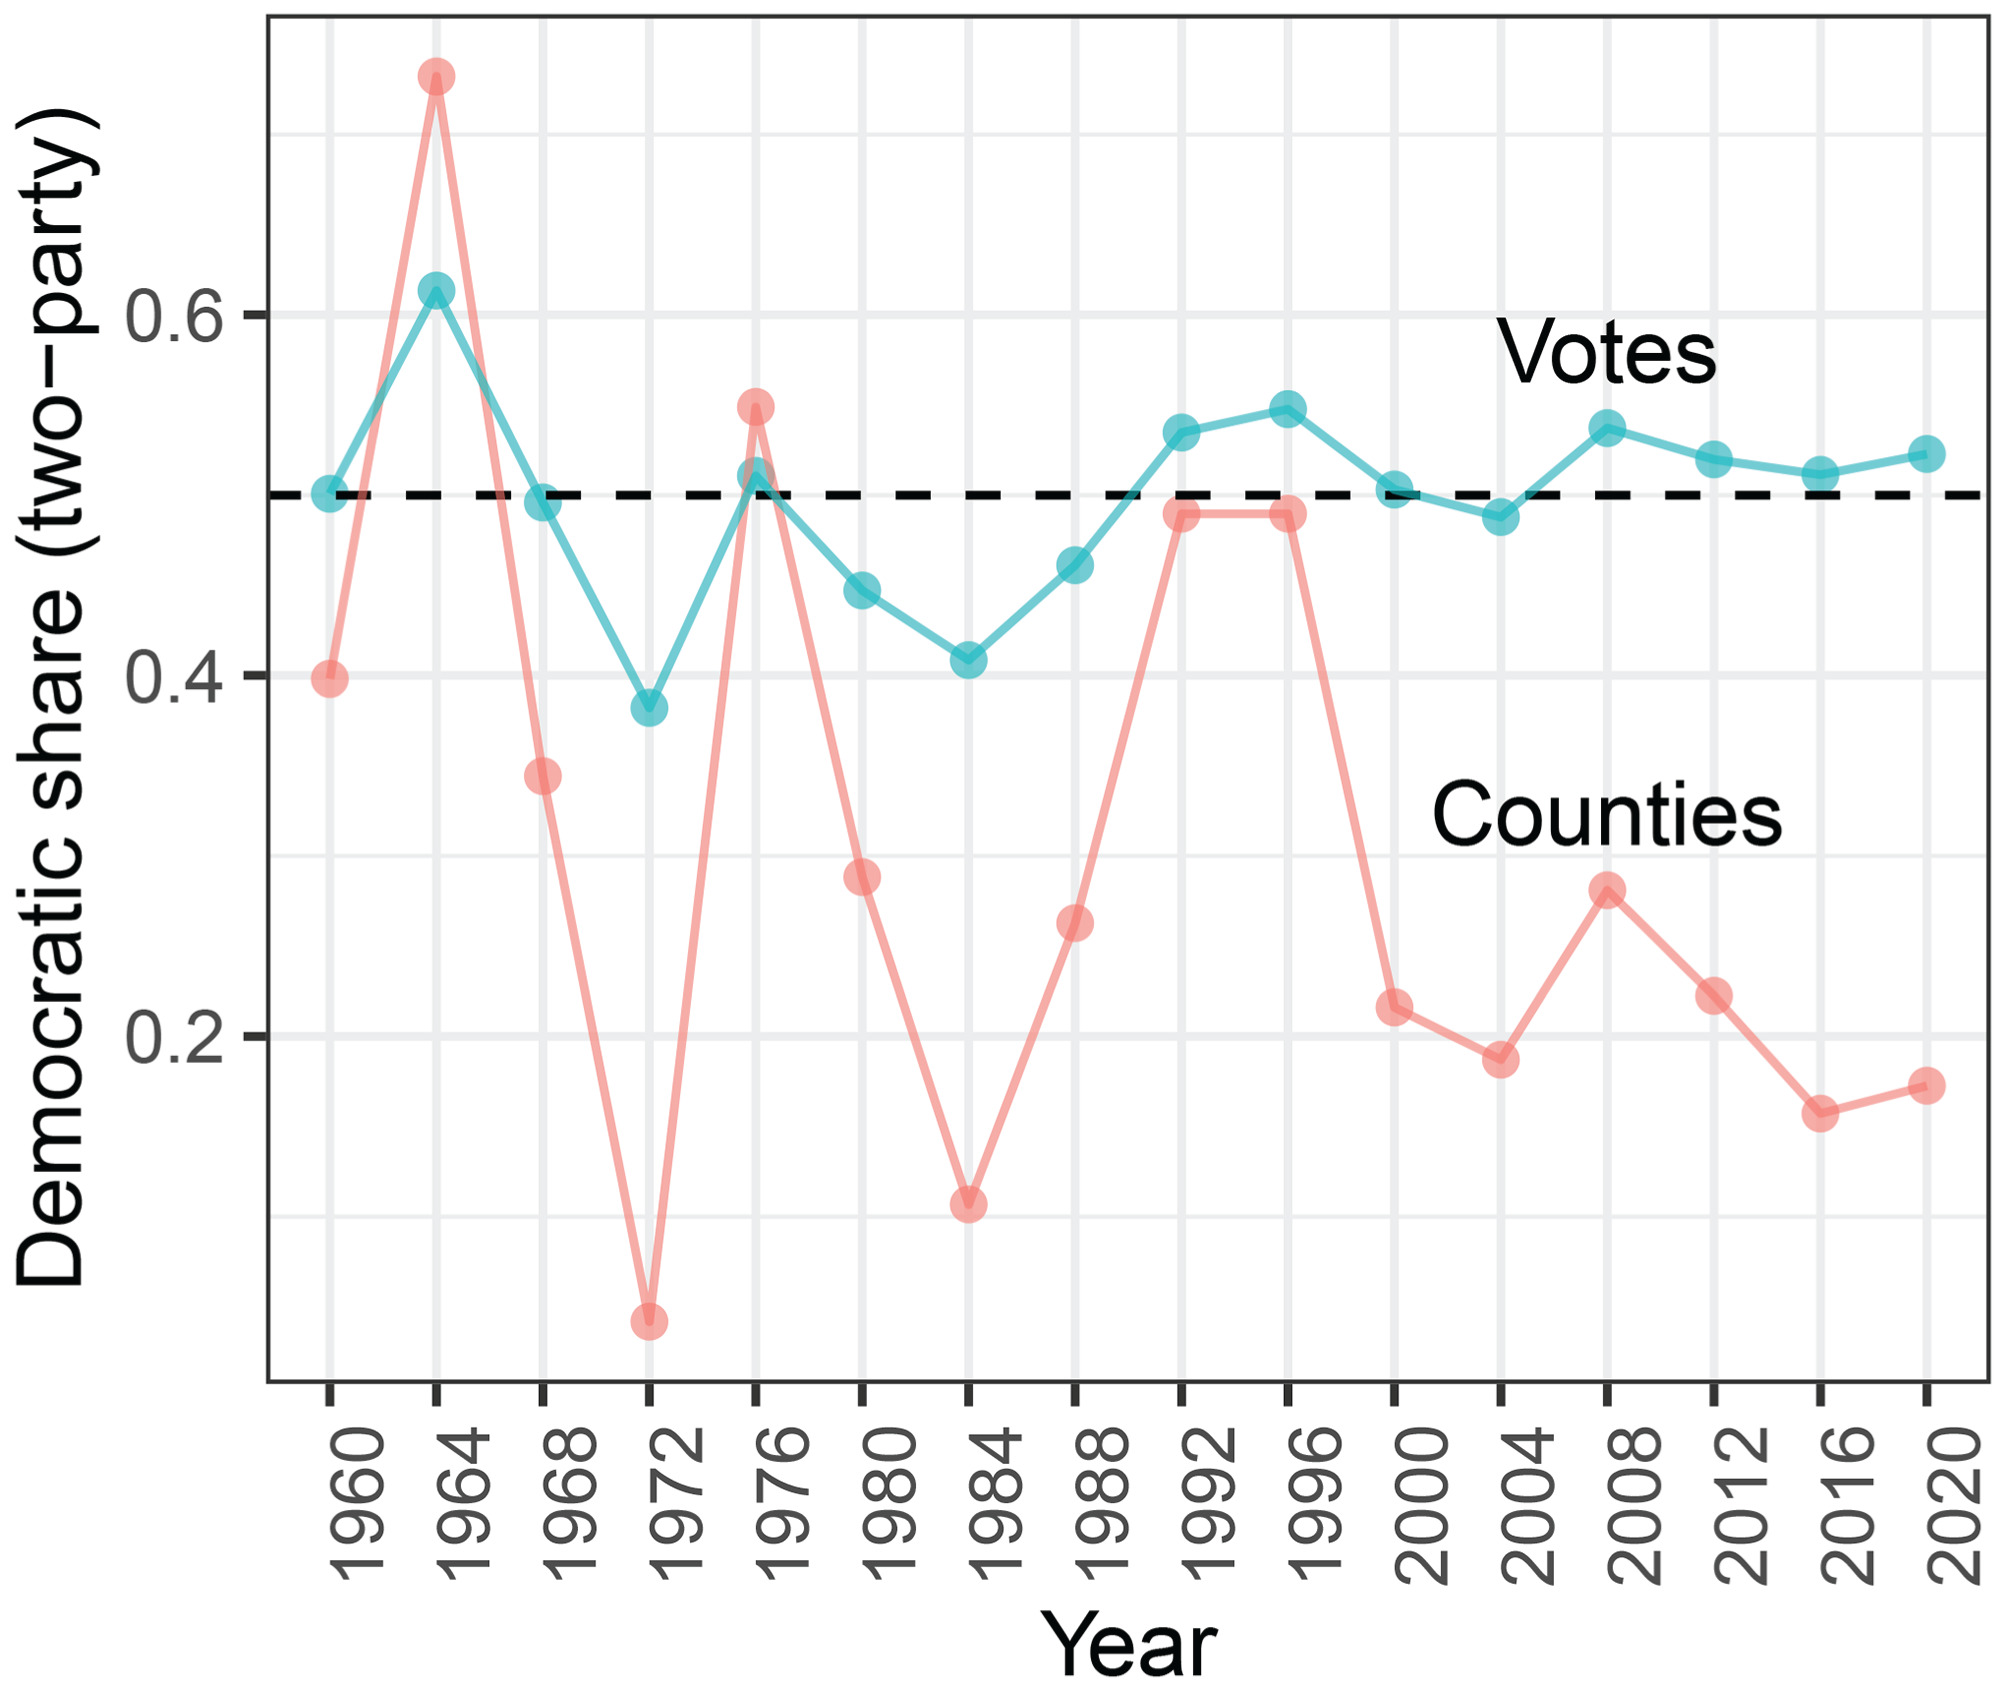
recent Democratic presidential candidates. Fig. 1
shows the proportion of votes and counties won by Democratic
presidential candidates over the last several decades. As Democratic
support has become more concentrated in cities, Democratic candidates
have tended to win a smaller share of counties even as their share of
votes holds steady. Judging by both votes and counties, Biden did
slightly better than Hillary Clinton in 2016 and worse than Obama in
2008. (Biden won many more votes than Obama, as Kirk pointed out, but a
smaller share of votes; turnout in 2020 was extraordinarily high.) Thus,
the supposedly incredible discrepancy Charlie Kirk highlighted is
simply the continuation of a stable trend in US presidential elections.
Fig. 1
Biden’s Share of Bellwether Counties Is Not Anomalous
A
related claim was made about Biden’s performance in “bellwether”
counties, which are counties where a majority of voters have supported
the election winner in several consecutive elections (8, 9).
Of the 19 counties that voted for the eventual winner in every
presidential election from 1980 to 2016, Biden defeated Trump in only
one. Several commentators viewed this fact as anomalous. As stated in The Federalist,
“Amazingly, [Biden] managed to secure victory while also losing in
almost every bellwether county across the country. No presidential
candidate has been capable of such electoral jujitsu until now” (10). Trump recited this fact in a rally in Georgia (11).
Biden’s
poor performance in bellwether counties makes sense given two facts.
First, at the county level there was remarkable continuity between 2016
and 2020.# Not only did Biden win roughly the same proportion of counties as Clinton in 2016 (as shown in Fig. 1), but also he won almost the same set of counties: As shown in Fig. 2A
only 63 counties switched from Trump to Biden. (For each county, we
show Democratic vote margin in 2016 on the horizontal axis and in 2020
on the vertical.) The 19 bellwether counties are highlighted in red.
Visual inspection suggests that, like other counties, they voted in 2020
roughly as they did in 2016; given this (and given that many of these
counties went solidly for Trump in 2016), it is unsurprising that Biden
won only one of them. Indeed, if we model the probability of Biden
winning a county as a function of the county’s Democratic margin in 2016
(making no distinction between bellwethers and others), we find that
Biden would be expected to win between one and two bellwethers. Fig. 2B
shows the probability of Biden winning a county in 2020 given the 2016
Democratic margin in the county, with the conditional relationship
calculated using a generalized additive model. The expected number of
bellwethers won by Biden is just 1.65 under this model; with alternative
models we get estimates between 1.2 and 1.8.
Fig. 2
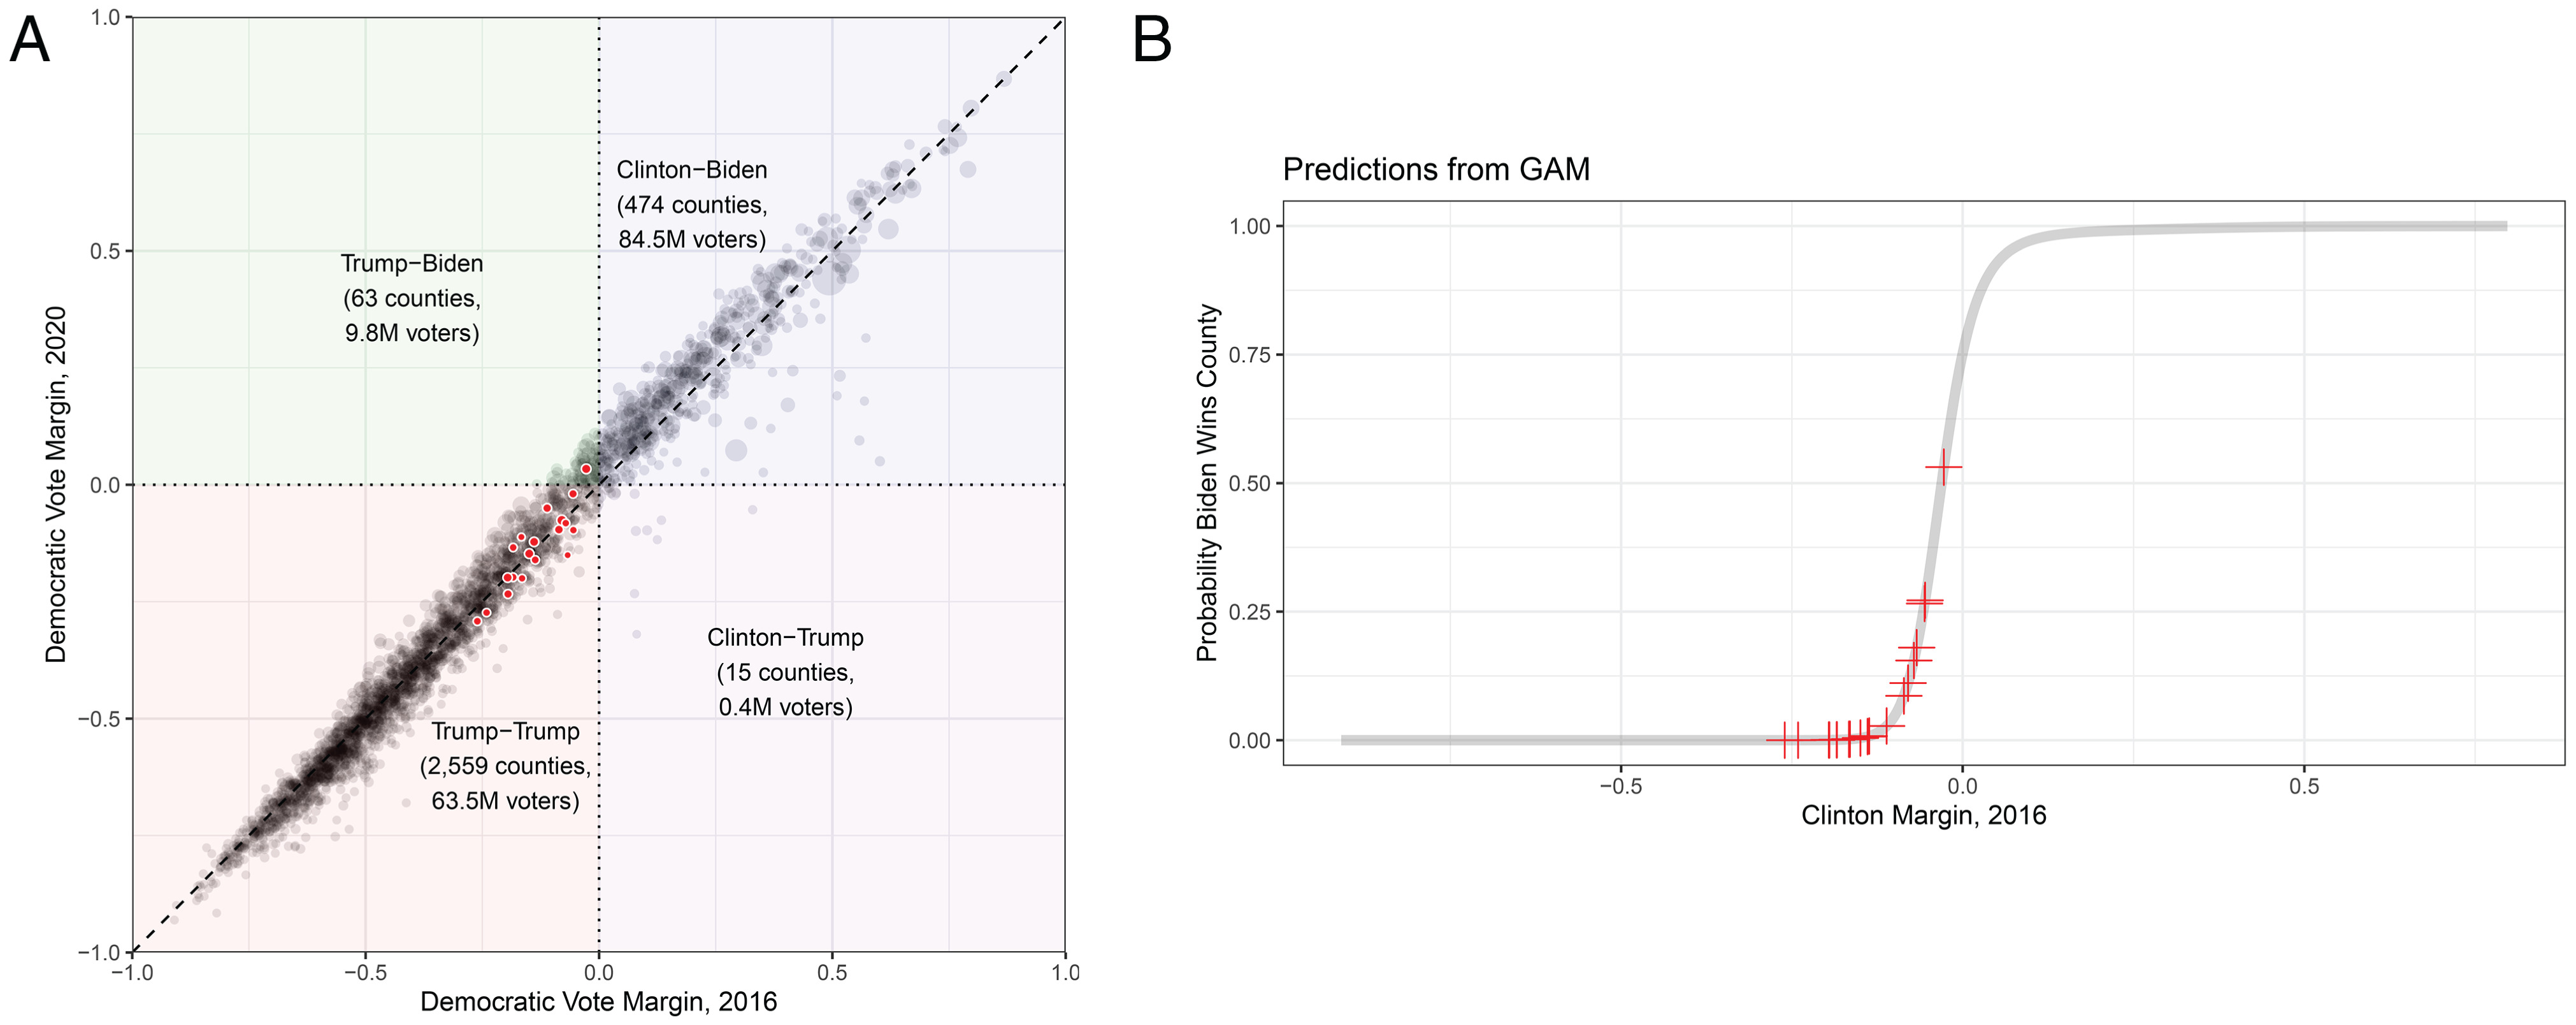
Fig. 2A suggests, and the analysis in Fig. 2B
assumes, that bellwether counties have no special tendency to side with
the winner, conditional on the prior election result. Further analysis
indicates that this has long been the case (8).
To assess whether bellwethers are more likely than other counties to
side with the winner in the future, we analyzed each election since
1996. We modeled a county’s probability of correctly choosing the winner
in a given election as a function of the Democratic margin in the
county in the previous election and an indicator for whether the county
had sided with the winner in each past election since 1980. We find only
one election since 1996 in which bellwethers were more likely to side
with the winner than other counties conditional on the county’s previous
election result (SI Appendix, Fig. 1).
Considering
that bellwether counties appear to have no special prognostic value in
general, and that county-level results were very similar in 2020 and
2016, it is neither surprising nor suspicious that Biden won just one of
19 bellwethers in 2020.
Differences between 2016 and 2020 Are Not Anomalous
Trump
advocates argued on the basis of a statistical analysis that there was a
“one-in-a-quadrillion” chance that Joe Biden legitimately won the
election. This claim comes from an expert report submitted as part of
Texas Attorney General Ken Paxton’s lawsuit against the Commonwealth of
Pennsylvania. In that report (12),
Paxton claims that the expert, Charles Cicchetti, calculated a one-
in-a-quadrillion chance of Biden winning; Cicchetti concludes his report
by arguing that “In my opinion, the outcome of Biden winning
Cicchetti’s assertion
that Biden’s victory was “statistically improbable” is based on a deeply
misguided application of null hypothesis significance testing.
Cicchetti never actually computes the probability of Biden winning.
Instead, he tests the null hypothesis that Joe Biden in 2020 and Hillary
Clinton in 2016 had the same expected number of votes in particular
states.‖
But if the objective is to assess whether Biden won legitimately, then
it is beside the point whether Biden and Clinton enjoyed the same
expected support. Support can differ across candidates for any number of
reasons, and it is absurd to think that any such difference constitutes
evidence of election fraud.
More
specifically, Cicchetti treats the number of Democratic votes in an
election as a binomially distributed random variable and tests the
hypothesis that the expected number of Democratic votes (e.g., in
Arizona) was the same for Joe Biden in 2020 as it was for Hillary
Clinton in 2016. Let
For
example, Biden won 0.494 of 3.33 million votes in Arizona in 2020,
while Clinton won 0.446 of 2.41 million votes in Arizona in 2016; this
yields z = 477.09, for a P value very close to zero. Given
that Biden won a substantially larger share of a much larger total, it
should not be surprising that we soundly reject the null hypothesis that
the two candidates had the same expected vote total. But it is
preposterous to attribute that difference to fraud rather than the
myriad innocuous differences between the two elections. It would be
similarly preposterous to conclude that something was suspicious about
TV ratings because fewer people watched the Super Bowl in 2020 than in
2016 (z statistic: 1,495) or to suspect foul play in COVID-19
vaccine trials because the number of infected participants differs
between two trials using different vaccines on different numbers of
participants.
To further highlight the
absurdity of Cicchetti’s test, we applied it to other years and states
since 1960. Unsurprisingly, we nearly always reject the null hypothesis
(1,488 state–year combinations of 1,498). By Cicchetti’s logic, this
suggests that fraud is commonplace across nearly all US states and
elections. In fact, the test indicates simply that elections differ from
each other, an unsurprising conclusion that tells us nothing about
fraud.
Patterns of Straight-Ticket and Split-Ticket Voting in Michigan Not Anomalous
In
a YouTube video with over 1 million views, Shiva Ayyadurai claimed to
provide evidence that voting machines in Michigan decisively switched
votes from Trump to Biden (13).
The analysis compares Trump’s share of straight-ticket votes and
Trump’s share of split-ticket votes across precincts in four Michigan
counties. (Voters in Michigan can tick a single box to vote straight
ticket for all candidates of one party or vote split ticket for
individual candidates.) Ayyadurai argues that, if ballots were counted
properly, the difference between those two proportions in a precinct
should be unrelated to Trump’s success among straight-ticket voters in
that precinct. In the four counties he analyzes, Ayyadurai finds instead
a negative linear relationship, which he interprets as evidence that
Biden stole votes from Trump.
Ayyadurai’s
argument has been debunked by others, including two analysts who point
out that the same logic would also imply that Trump stole votes from
Biden in the same counties (14, 15).
We show that the negative relationship Ayyadurai takes as evidence of
fraud is an expected consequence of regression to the mean and that the
same pattern should be found when fraud is absent.
Let Xi and Yi denote Trump’s share of straight-ticket votes and split-ticket votes in precinct i, respectively. Ayyadurai’s observation is then that
This
suggests that we should find Ayyadurai’s negative relationship in other
elections in which voters may vote straight ticket or split ticket and
fraud is not suspected. Conveniently, in a follow-up video Ayyadurai
points out that the 2008 presidential election in Alabama was just such
an election (16).
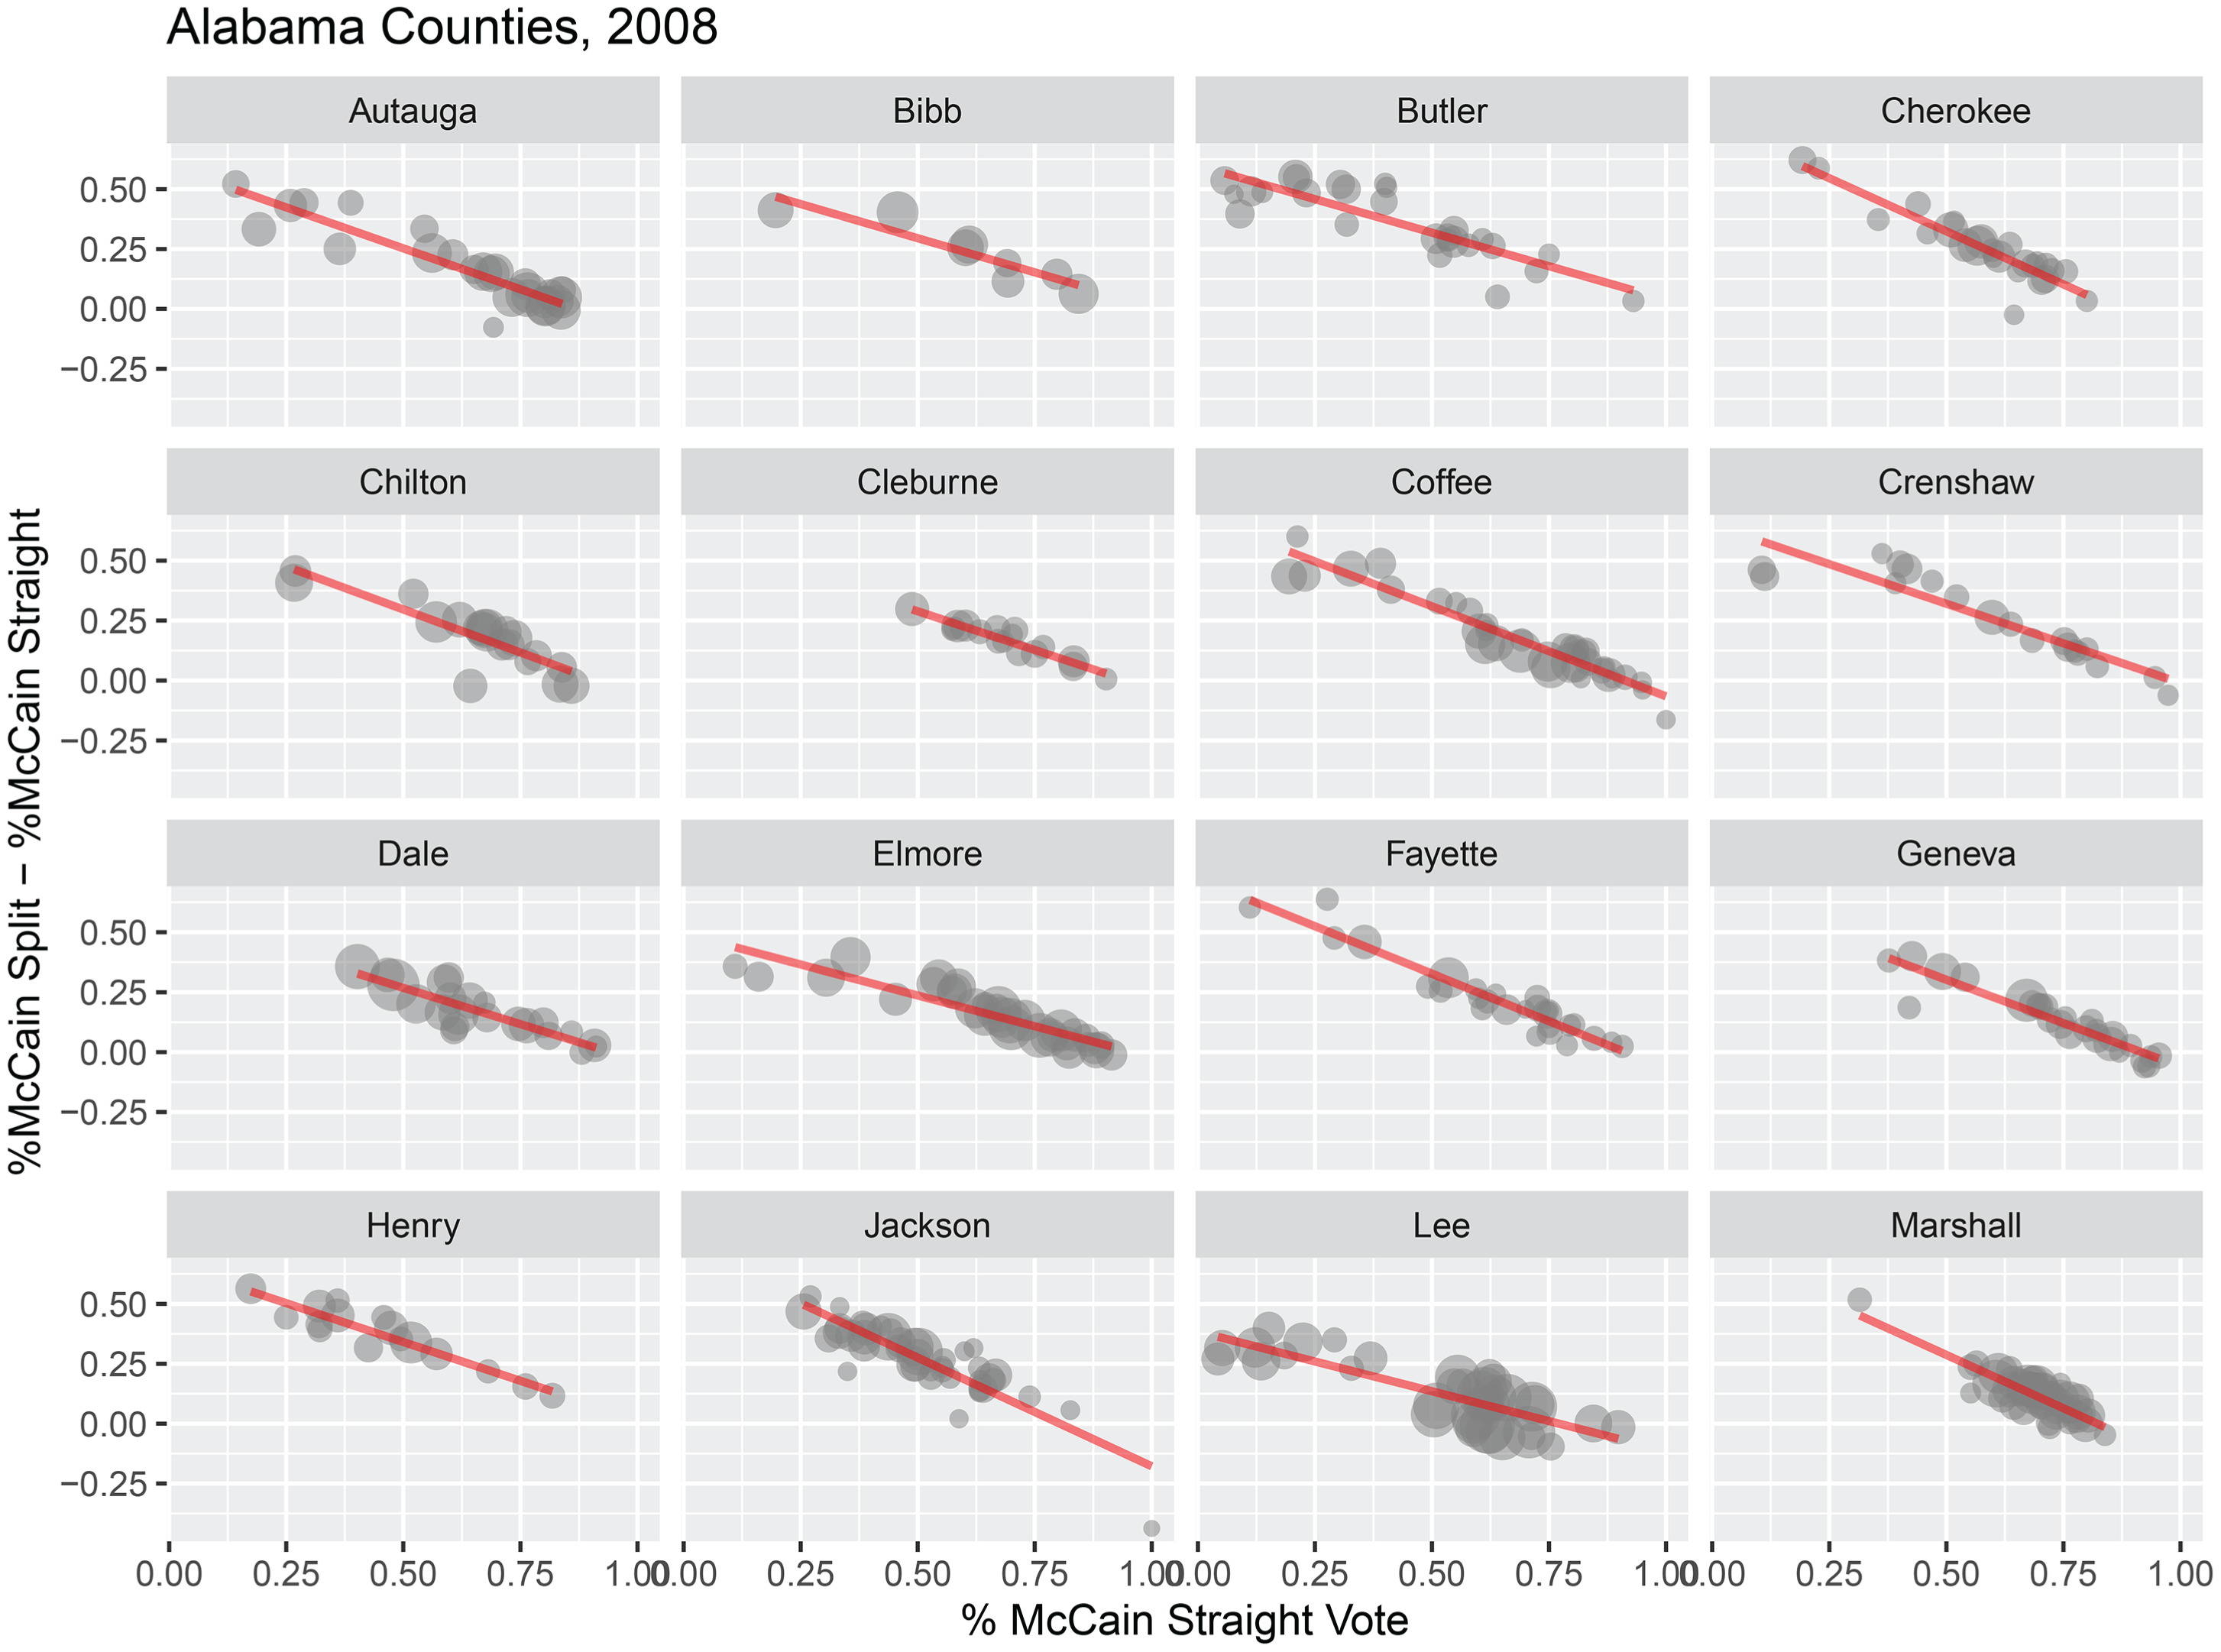
We therefore check the 2008 Alabama election returns for patterns like
the one Ayyadurai observes in Michigan in 2020. As expected, many
Alabama counties exhibit precisely the negative relationship in 2008
that Ayyadurai considers evidence of fraud in Michigan counties in 2020,
as shown in Fig. 3. (Each dot is a precinct,
scaled by the number of votes cast in the precinct; the red line is the
linear prediction.) This confirms that the relationship Ayyadurai
highlights is a feature of normal elections and not proof of fraud. In SI Appendix, Fig. 3
we show that in 32 of 35 Alabama counties the slope coefficient from a
regression of McCain’s split-ticket share on his straight-ticket share
is less than 1, and in 29 of those counties we reject the null that the
slope is 1.
Fig. 3
Claims Based on Facts That Are Not Actually Facts
Dominion Voting Machines Do Not Decrease Trump Vote Share
Trump’s
legal team claimed after the election that voting machines run by
Dominion Voting Systems switched votes from Trump to Biden. Trump
lawyers Rudy Giuliani and Sidney Powell argued for a global conspiracy
that undermined democracy everywhere Dominion was present. In late
December, an anonymous analysis was widely circulated on social media
claiming to show that Biden outperformed expectations in counties that
used Dominion voting machines (17). The right-wing news outlet The Epoch Times
reported that the analysis showed Biden outperformed expectations in
78% of the counties that use Dominion or Hart voting machines and that
the analysis “also indicates that Biden consistently received 5.6
percent more votes in those counties than he should have” (18).
Assessing whether a particular set of voting machines caused Biden to
receive more votes is difficult, because machines are not randomly
assigned to counties (19). Further, in SI Appendix, section E we present analyses indicating that the original study was the result of P hacking and careless data analysis.
Given
these problems with the original analysis, we carry out our own
analysis to check for evidence that Dominion machines switched votes
from Trump to Biden. In Table 1, column 1 we show the
results of a bivariate regression of Biden’s share in 2020 on an
indicator for whether the county used a Dominion machine, finding a very
slight and statistically insignificant difference. In Table 1, column 2 we adjust for Clinton’s share of the vote in 2016, which strongly predicts the 2020 outcome (note the R 2 of 0.964); the Dominion coefficient becomes very slightly negative, although again it is not significant. In Table 1, column 3 we add a dummy variable indicating whether the county is in a state where any Dominion machines were used and in Table 1,
column 4 we add a fixed effect for each state; in both cases we find
coefficients that are statistically significant in the negative (i.e.,
pro-Trump) direction, although very small in magnitude. In Table 1
we find the same null effect of Dominion voting machines persists
regardless of how we classify a county as using Dominion machines, once
we account for confounding at the state level and for county-level
demographics. In short, using the most rigorous specifications we find
no evidence that Biden outperformed expectations in counties where
Dominion machines were used.
Table 1
| Dependent variable: Biden vote share, 2020 | ||||
|---|---|---|---|---|
| 1 | 2 | 3 | 4 | |
| Dominion machines | 0.007 | –0.002 | –0.009 | –0.006 |
| (0.010) | (0.002) | (0.002) | (0.003) | |
| Clinton share of vote, 2016 | 1.032 | 1.029 | 1.011 | |
| (0.004) | (0.004) | (0.004) | ||
| Observations | 3,111 | 3,111 | 3,111 | 3,111 |
| R 2 | 0.0002 | 0.964 | 0.965 | 0.975 |
| Dummy for “Dominion state” | ✓ | |||
| State fixed effects | ✓ | |||
Data
from all states and the coding of Dominion voting systems from the US
Election Assistance Commission are used. SEs in parentheses.
Absentee Ballot Counting Procedures Do Not Decrease Trump Vote Share
Another
focus of the Trump team’s accusations was the processing of absentee
ballots in key states that Biden narrowly won. Among other claims, they
alleged that Fulton County, GA, and Allegheny County, PA, were major
centers of voter fraud in the 2020 election. Most of these allegations
relied upon hearsay affidavits or debunked videos purportedly showing
voters stuffing ballots. But in a paper posted in late December 2020,
Lott (20)
claims to provide statistical evidence that irregularities in the
absentee vote counting procedure in Fulton County and Allegheny County
suppressed votes for Trump and bolstered Biden’s vote count. Lott
examined precincts along the border of Fulton and Allegheny Counties and
argued that he detected anomalous support for Biden in his absentee
ballot share relative to his in-person share of ballots in Fulton and
Allegheny Counties. Lott’s paper received immediate and widespread
attention. Peter Navarro, Assistant to the President and Director of the
Office of Trade and Manufacturing Policy, touted the claim as solid
evidence of fraud. President Trump tweeted out a link to the paper.
Lott’s claims, however, do not withstand scrutiny. Using Lott’s own data, we show in SI Appendix, section G
that the specification he uses to analyze absentee voting patterns
produces different conclusions depending on the entirely arbitrary order
in which counties are entered in the dataset. Briefly, Lott posits
that, if absentee ballots were correctly handled, the difference in
Trump support across a boundary that separates a Democratic county from a
Republican county should be similar to the difference in Trump support
across a boundary that separates one Republican county from another. But
Lott’s conclusion depends entirely on the order in which the
differences are computed for the Republican–Republican pairs. The
conclusion is reversed when an alternative and equally justified order
is used.
To achieve Lott’s objective of
comparing voting patterns across county boundaries, we reanalyze Lott’s
data using a more standard specification that does not suffer from these
problems. We use the same pairs of precincts that Lott (20)
used in his analysis to limit the confounding between precincts in
different counties, but we now use a simple fixed-effects model that
resolves the issue with Lott’s (20) original specification. The regression equation for this model can be written as
[1]
Table 2
| Dependent variable: Trump share absentee | ||||
|---|---|---|---|---|
| Georgia | Pennsylvania | |||
| 1 | 2 | 1 | 2 | |
| Trump share, in person | 0.760 | 0.606 | 0.511 | 0.307 |
| (0.049) | (0.077) | (0.042) | (0.066) | |
| Suspect county | 0.019 | –0.003 | 0.003 | 0.003 |
| (0.019) | (0.020) | (0.008) | (0.009) | |
| Observations | 44 | 44 | 174 | 174 |
| Precinct-pair fixed effects | ✓ | ✓ | ||
A
fixed-effects specification shows nothing suspicious in Fulton County,
GA, and nothing suspicious in Allegheny County, PA. SEs in parentheses.
Turnout Was Not Unusually High in Counties Where Republicans Made Fraud Accusations
Lott (20)
also claims to show that 2020 turnout rates were higher than one would
otherwise expect in a set of counties where Republicans have alleged
that fraud took place. Lott argues that there was an “unexplained
increase in voter turnout” ref. 20, p.13 in the key counties of between
1.26 and 2.42%, which Lott says is equivalent to 150,000 to 289,000
votes in those states. Lott concludes that this is evidence consistent
with fraud.
To determine whether the
“suspicious” counties had higher turnout, Lott checks whether turnout in
the 2020 election was higher than would be expected (given previous
turnout, political leaning, and local demographics) in counties where,
according to Republican lawsuits filed after the election, fraud may
have taken place. Lott identifies 19 counties across six swing states
where Republicans made fraud allegations.††
He then compares turnout in these counties to turnout in other counties
in the same six states plus all counties in three other swing states
(Florida, Ohio, and North Carolina). He argues that, if turnout is
higher in these counties than would be expected given covariates, it
would be evidence of fraud.
As we explain in SI Appendix, section H
we dispute the premise of this analysis: Turnout varies across counties
for many reasons, and it is unreasonable to ascribe a small unexplained
difference to fraud. As it happens, Lott’s finding is not robust to
sensible departures from his chosen specification, so it is not
necessary to dispute the premise.
Our analysis of county-level voting data for 2016 and 2020‡‡
indicates that Lott’s conclusions are driven by the inclusion of states
that have lower turnout increases and no suspicious counties—namely
Florida, North Carolina, and Ohio. Fig. 4A
shows that, conditional on turnout in 2016, turnout in these three
states was lower than turnout in the six states that contain a
suspicious county in Lott’s analysis. This is relevant because Lott’s
analysis compares changes in turnout in suspicious counties with changes
in turnout in all other counties, so these smaller increases in turnout
rates across states will be conflated with the suspicious county
indicator in his analysis. The smaller the turnout increase in these
three “nonsuspect” states, the more turnout in the suspect counties will
appear to be suspiciously high, even if the changes in turnout in these
suspect counties are unremarkable relative to the changes in turnout in
other counties in their own state.
Fig. 4
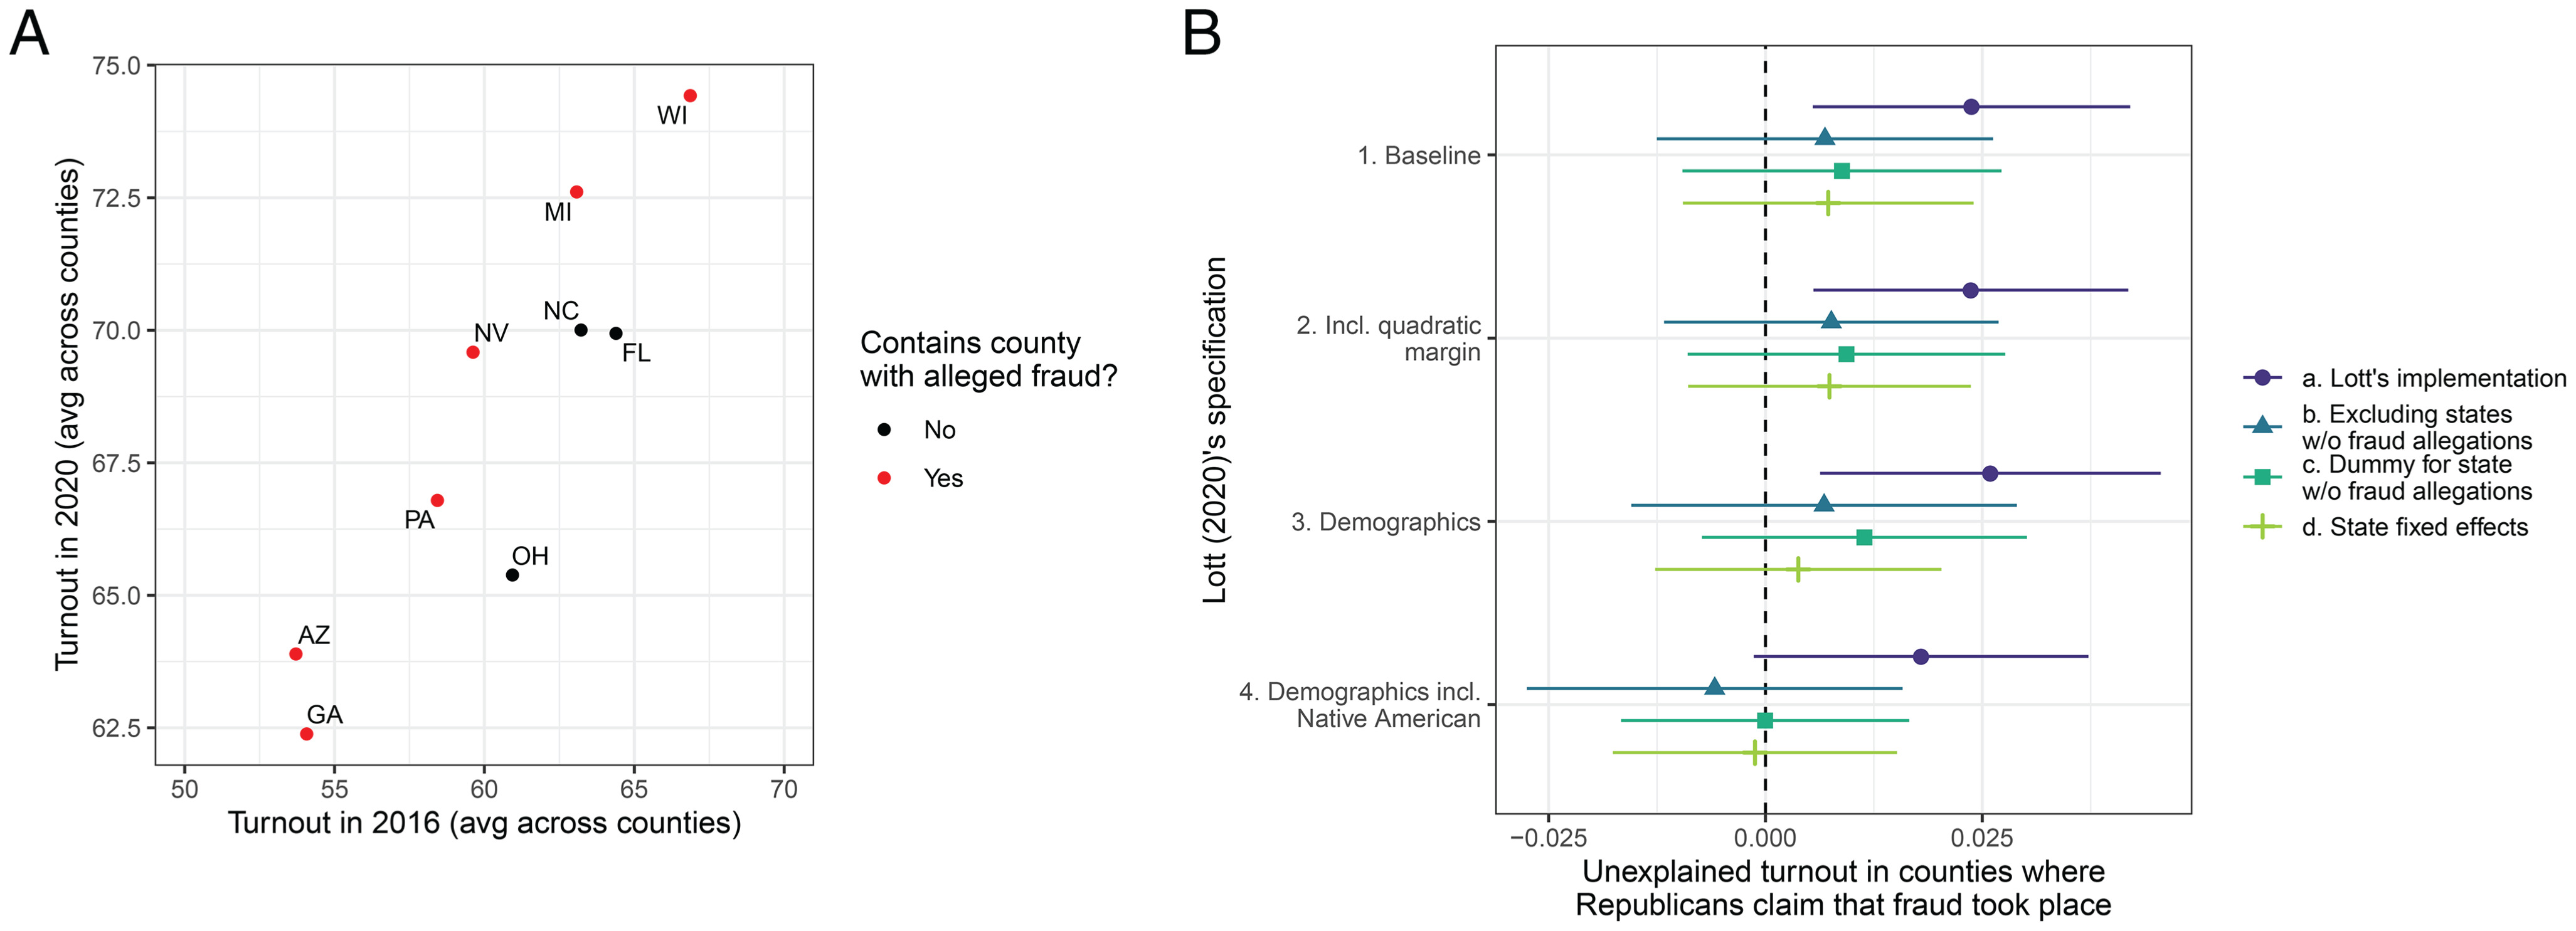
Fig. 4B shows that, once we address the level differences across states, Lott’s (20)
estimates of the turnout differences in suspicious counties go to zero
and become insignificant. We examine all four of Lott’s (20)
models (organized on the vertical axis) and present the estimated
coefficient on an indicator for “suspicious county” in a regression of
2020 turnout on that indicator plus 2016 turnout and covariates. The
circle/purple estimates of suspicious county turnout depict the
estimates using the four specifications for which Lott (20)
presents results in his table 10. The triangle/dark-green estimates
depict our estimates when we exclude Florida, Ohio, and North
Carolina—three states in which no fraud was alleged. Across models, the
difference in suspicious counties is close to zero and—in the case of
model 4—the estimate is negative. The square/light-green estimates are
from a model where we include all of Lott’s states but add an indicator
for a state that has suspicious counties. Again, this reduces the
estimate to null. Finally, the last estimates (plus/lime green) include
state-level fixed effects. Across models, this gives a close to zero and
null difference for suspicious counties. Thus, simply by focusing only
on states where at least one county had alleged fraud (i.e., swing
states that Biden won) or allowing that state-wide turnout trends may
differ across states or groups of states, we are able to explain what
Lott (20) claimed was unexplained turnout in counties where Republicans had claimed fraud.
In
short, there is no evidence that turnout was unusually high in the
suspicious counties, let alone that turnout was inflated in these
counties by fraud.
Statistical Analyses of Elections, the Detection of Fraud, and the Spread of Misinformation
Even
though the 2020 election is over and Donald Trump’s attempt to overturn
the results failed, the effects of the claims will reverberate for
years. A large segment of the public remains skeptical that Biden won
the election legitimately and Republican state lawmakers are taking
steps to alter voting access in the name of preventing fraud. The Trump
campaign delivered a blueprint for losing candidates to undermine
support for the winner or even steal the election. It seems unlikely
that he will be the last to try these tactics.
We
have closely examined what we consider the most prominent statistical
claims of fraud in the 2020 election. Although the claims are diverse,
our conclusion is consistent: For each claim, we find that what is
purported to be an anomalous fact about the election result is either
not a fact or not anomalous. In many cases the alleged fact, if shown to
withstand scrutiny, would hardly constitute convincing evidence that
Biden was elected due to fraud: A modest advantage to Biden in counties
that chose to use Dominion machines, for example, could be explained by
chance, by factors not accounted for in statistical models, or indeed by
pro-Trump fraud undertaken using other voting machines. As it happens,
the allegedly anomalous features we consider appear mundane once
properly measured or placed in the appropriate context.
In
some cases, members of the public who are confronted with a statistical
claim of election fraud can apply the approach we took in this paper:
First, ask whether the allegedly anomalous fact is a fact; if so, ask
whether it is anomalous. In many cases, assessing the validity and
unexpectedness of an allegedly anomalous fact requires some statistical
sophistication and even original data analysis. For these cases, we
think academics (and data journalists and others with appropriate
skills) have an important role to play. To safeguard future election
results, it will be essential to have elections experts ready to
evaluate claims made about whether an election is free and fair. We
think that social media organizations can do more to broadcast these
evidence-based claims rather than merely flagging questionable
assertions as disputed or asserting that the election was free and fair.
Rebuilding
trust in American elections requires that we fairly evaluate claims
about their failures and communicate those claims to a skeptical public.
This paper is an effort in that direction.
Notes
See online for related content such as Commentaries.
*
SI Appendix, section A describes our search process.
§
By “counties” we mean counties and county equivalents, e.g., parishes in Louisiana.
¶
Turning
Kirk’s question around, one could ask, If Trump won so few votes, how
could he have legitimately won so many counties? The same point could be
made for many of these claims.
#
SI Appendix, Fig. 2 shows that the serial correlation in county-level election results has increased steadily to a new high in 2020.
‖
He
also tests the hypothesis that Biden’s early and late vote counts were
the same in specific states. This test is subject to the same critique,
which we show in SI Appendix, section D.
**
To see this, suppose that underlying Trump support is given by Ti and that
††
Lott
identifies the following suspicious counties—in Georgia, Fulton and
DeKalb; in Pennsylvania, Allegheny, Centre, Chester, Delaware,
Montgomery, Northampton, and Philadelphia; in Arizona, Apache, Coconino,
Maricopa, and Navajo; in Michigan, Wayne; in Nevada, Clark and Washoe;
and in Wisconsin, Dane.
‡‡
We
use turnout rates for the county citizen voting-age population. For the
number of voting-aged citizens we use the 5-y American Community Survey
from 2019 and 2015. This follows best practice from McDonald (21). For total votes, we use Leip (22). We note that our estimates of turnout are lower than Lott’s (20) average turnout rates, but closer to official statistics.
Data Availability
Election results data have been deposited in Code Ocean at https://codeocean.com/capsule/0007435/tree/v2.
Supporting Information
Appendix 01 (PDF)
- Download
- 931.90 KB
References
1
J.
Zilinsky, J. Nagler, J. Tucker, Which Republicans are most likely to
think the election was stolen? Those who dislike democrats and don’t
mind white nationalists. Washington Post, 19 January 2021. https://
www.washingtonpost.com/politics/2021/01/19/which-republicans-think-
election-was-stolen-those-who-hate-democrats-dont-mind-white-
nationalists. Accessed 19 January 2021.
2
D.
Cottrell, M. C. Herron, S. J. Westwood, An exploration of Donald
Trump’s allegations of massive voter fraud in the 2016 general election.
Elect. Stud. 51, 123–142 (2018).
3
M. C. Herron, Mail-in absentee ballot anomalies in North Carolina’s 9th congressional district. Elect. Law J. Rules Polit. Policy 18, 191–213 (2019).
4
W. R. Mebane, Comment on “Benford’s law and the detection of election fraud”. Polit. Anal. 19, 269–272 (2011).
5
N. Idrobo, D. Kronick, F. Rodríguez, Do Shifts in Late-Counted Votes Signal Fraud? Evidence from Bolivia (University of Pennsylvania, 2020).
6
J. Rodden, Expert report of Jonathan Rodden, PhD in Pearson v. Kemp. https://1library.net/document/qm8mlnwz-december-pearson-united-states-district-northern-district-georgia.html. Accessed 20 October 2021.
7
G. King, Expert report of Gary King, in Bowyer et al. v. Ducey (governor) et al., US district court, district of Arizona. https://gking.harvard.edu/publications/expert-report-gary-king-bowyer-et-al-v-ducey-governor-et-al-us-district-court. Accessed 20 October 2021.
8
E. R. Tufte, R. A. Sun, Are there bellwether electoral districts? Public Opin. Q. 39, 1–18 (1975).
9
D. Zimny-Schmitt, M. Harris, An inquiry of bellwether counties in US presidential elections. SSRN [Preprint] (2020). https://papers.ssrn.com/sol3/papers.cfm?abstract_id=3677602. Accessed 20 October 2021.
10
J. Shurk, 5 more ways Joe Biden magically outperformed election norms. The Federalist, 23 November 2020. https://thefederalist.com/2020/11/23/5-more-ways-joe-biden-magically-outperformed-election-norms/. Accessed 7 December 2020.
11
P. Bump, No, Biden’s win wasn’t ‘statistically impossible.’ Washington Post, 7 December 2020. https://www.washingtonpost.com/politics/2020/12/07/no-bidens-win-wasnt-statistically-. Accessed 1 December 2020.
12
C. Cicchetti, Expert report of Charles Cicchetti in Texas vs Pennsylvania. https://electioncases.osu.edu/wp-content/uploads/2020/12/TX-v-PA-Appendix-first-half.pdf. Accessed 10 December 2020.
13
S.
Ayyadurai, “Dr. Shiva live: MIT PhD analysis of Michigan votes reveals
unfortunate truth of US voting systems” (video recording, 2020). https://www.youtube.com/watch?v=Ztu5Y5obWPk. Accessed 10 February 2021.
14
N. Kabir, The fraud of Dr. Shiva Ayyadurai: Oakland county, Michigan. https://naim-kabir.medium.com/the-fraud-of-dr-shiva-ayyadurai-oakland-county-michigan-1bc51bcebf1b. Accessed 10 February 2021.
15
M. Parker, “Do these scatter plots reveal fraudulent vote-switching in Michigan?” (video recording, 2020). https://www.youtube.com/watch?v=aokNwKx7gM8. Accessed 10 February 2021.
16
S.
Ayyadurai, “Dr. Shiva live: MIT PhD continued analysis of Michigan
votes reveals more election fraud” (video recording, 2020). https://www.youtube.com/watch?v=R8xb6qJKJqU&feature=youtu.be. Accessed 10 February 2021.
17
Anonymous, Evidence of fraud in conjunction with use of dominion BMD machines. https://thepartyoftrump.com/media/FraudInCountiesUsingDominionVotingMachines.pdf. Accessed 10 January 2021.
18
A. Zhong, Joe Biden appears to outperform in counties using dominion or hart voting machines: Data analyst. Epoch Times, 19 December 2020. https://
www.theepochtimes.com/joe-biden-appears-to-outperform-in-counties-using-
dominion-or-hart-voting-machines-data-analyst_3625672.html. Accessed 10 January 2021.
19
M. C. Herron, J. Wand, Assessing partisan bias in voting technology: The case of the 2004 New Hampshire recount. Elect. Stud. 26, 247–261 (2007).
20
J.
R. Lott, A simple test for the extent of vote fraud with absentee
ballots in the 2020 presidential election: Georgia and Pennsylvania
data. SSRN [Preprint] (2020). https://papers.ssrn.com/sol3/papers.cfm?abstract_id=3756988. Accessed 20 October 2021.
21
M. McDonald, I want congressional, state legislative district, or county VEP turnout rates. http://www.electproject.org/home/voter-turnout/faq/congress. Accessed 15 January 2021.
22
D. Leip, Dave Leip’s Atlas of U.S. Presidential Elections. https://uselectionatlas.org/. Accessed 20 October 2021.
Information & Authors
Information
Published in

Classifications
Copyright
Copyright © 2021 the Author(s). Published by PNAS. This open access article is distributed under Creative Commons Attribution-NonCommercial-NoDerivatives License 4.0 (CC BY-NC-ND).
Data Availability
Election results data have been deposited in Code Ocean at https://codeocean.com/capsule/0007435/tree/v2.
Submission history
Accepted: August 30, 2021
Published online: November 2, 2021
Published in issue: November 9, 2021
Keywords
Notes
This article is a PNAS Direct Submission.
Authors
Competing Interests
The authors declare no competing interest.
Metrics & Citations
Metrics
Altmetrics

Citations
Cite this article
No evidence for systematic voter fraud: A guide to statistical claims about the 2020 election, Proc. Natl. Acad. Sci. U.S.A.
118 (45) e2103619118,
https://doi.org/10.1073/pnas.2103619118
(2021).
Copied!
Copying failed.
Export the article citation data by selecting a format from the list below and clicking Export.
Cited by
Loading...
View Options
Figures
Fig. 1
Biden’s share of votes and counties won in 2020 is typical of that of recent Democratic presidential candidates.
Fig. 2
A
plot shows Democratic vote margin in 2016 (horizontal axis) and 2020
(vertical axis) by county: Support in most counties did not shift much,
and bellwethers (colored red) were no exception. B plot
calculates the expected share of counties Biden won given the 2016
Democratic margin. Trump’s margin in bellwether counties (red plus) was
large and Biden won only a small share of those. We use several flexible
models to calculate Biden’s expected number of bellwether county wins
if they behave like other counties and we find that Biden would be
expected win between 1.24 and 1.75 bellwethers.
Fig. 3
Several
counties in Alabama in 2008 show the same relationship between
split-ticket voting and straight-ticket voting that Ayyadurai interprets
as evidence of fraud in Michigan in 2020.
Fig. 4
Tables
Media
References
References
1
J.
Zilinsky, J. Nagler, J. Tucker, Which Republicans are most likely to
think the election was stolen? Those who dislike democrats and don’t
mind white nationalists. Washington Post, 19 January 2021. https://
www.washingtonpost.com/politics/2021/01/19/which-republicans-think-
election-was-stolen-those-who-hate-democrats-dont-mind-white-
nationalists. Accessed 19 January 2021.
2
D.
Cottrell, M. C. Herron, S. J. Westwood, An exploration of Donald
Trump’s allegations of massive voter fraud in the 2016 general election.
Elect. Stud. 51, 123–142 (2018).
3
M. C. Herron, Mail-in absentee ballot anomalies in North Carolina’s 9th congressional district. Elect. Law J. Rules Polit. Policy 18, 191–213 (2019).
4
W. R. Mebane, Comment on “Benford’s law and the detection of election fraud”. Polit. Anal. 19, 269–272 (2011).
5
N. Idrobo, D. Kronick, F. Rodríguez, Do Shifts in Late-Counted Votes Signal Fraud? Evidence from Bolivia (University of Pennsylvania, 2020).
6
J. Rodden, Expert report of Jonathan Rodden, PhD in Pearson v. Kemp. https://1library.net/document/qm8mlnwz-december-pearson-united-states-district-northern-district-georgia.html. Accessed 20 October 2021.
7
G. King, Expert report of Gary King, in Bowyer et al. v. Ducey (governor) et al., US district court, district of Arizona. https://gking.harvard.edu/publications/expert-report-gary-king-bowyer-et-al-v-ducey-governor-et-al-us-district-court. Accessed 20 October 2021.
8
E. R. Tufte, R. A. Sun, Are there bellwether electoral districts? Public Opin. Q. 39, 1–18 (1975).
9
D. Zimny-Schmitt, M. Harris, An inquiry of bellwether counties in US presidential elections. SSRN [Preprint] (2020). https://papers.ssrn.com/sol3/papers.cfm?abstract_id=3677602. Accessed 20 October 2021.
10
J. Shurk, 5 more ways Joe Biden magically outperformed election norms. The Federalist, 23 November 2020. https://thefederalist.com/2020/11/23/5-more-ways-joe-biden-magically-outperformed-election-norms/. Accessed 7 December 2020.
11
P. Bump, No, Biden’s win wasn’t ‘statistically impossible.’ Washington Post, 7 December 2020. https://www.washingtonpost.com/politics/2020/12/07/no-bidens-win-wasnt-statistically-. Accessed 1 December 2020.
12
C. Cicchetti, Expert report of Charles Cicchetti in Texas vs Pennsylvania. https://electioncases.osu.edu/wp-content/uploads/2020/12/TX-v-PA-Appendix-first-half.pdf. Accessed 10 December 2020.
13
S.
Ayyadurai, “Dr. Shiva live: MIT PhD analysis of Michigan votes reveals
unfortunate truth of US voting systems” (video recording, 2020). https://www.youtube.com/watch?v=Ztu5Y5obWPk. Accessed 10 February 2021.
14
N. Kabir, The fraud of Dr. Shiva Ayyadurai: Oakland county, Michigan. https://naim-kabir.medium.com/the-fraud-of-dr-shiva-ayyadurai-oakland-county-michigan-1bc51bcebf1b. Accessed 10 February 2021.
15
M. Parker, “Do these scatter plots reveal fraudulent vote-switching in Michigan?” (video recording, 2020). https://www.youtube.com/watch?v=aokNwKx7gM8. Accessed 10 February 2021.
16
S.
Ayyadurai, “Dr. Shiva live: MIT PhD continued analysis of Michigan
votes reveals more election fraud” (video recording, 2020). https://www.youtube.com/watch?v=R8xb6qJKJqU&feature=youtu.be. Accessed 10 February 2021.
17
Anonymous, Evidence of fraud in conjunction with use of dominion BMD machines. https://thepartyoftrump.com/media/FraudInCountiesUsingDominionVotingMachines.pdf. Accessed 10 January 2021.
18
A. Zhong, Joe Biden appears to outperform in counties using dominion or hart voting machines: Data analyst. Epoch Times, 19 December 2020. https://
www.theepochtimes.com/joe-biden-appears-to-outperform-in-counties-using-
dominion-or-hart-voting-machines-data-analyst_3625672.html. Accessed 10 January 2021.
19
M. C. Herron, J. Wand, Assessing partisan bias in voting technology: The case of the 2004 New Hampshire recount. Elect. Stud. 26, 247–261 (2007).
20
J.
R. Lott, A simple test for the extent of vote fraud with absentee
ballots in the 2020 presidential election: Georgia and Pennsylvania
data. SSRN [Preprint] (2020). https://papers.ssrn.com/sol3/papers.cfm?abstract_id=3756988. Accessed 20 October 2021.
21
M. McDonald, I want congressional, state legislative district, or county VEP turnout rates. http://www.electproject.org/home/voter-turnout/faq/congress. Accessed 15 January 2021.
22
D. Leip, Dave Leip’s Atlas of U.S. Presidential Elections. https://uselectionatlas.org/. Accessed 20 October 2021.